Technically, all major indexes sit around their 200dMA – which means nothing really, other than everyone is watching it. Therefore, this level becomes a psychologically important level. A retracement from these levels is basically a self-fulfilling prophecy as everyone expects a fall of some sorts from here. Investors Business Daily counts only 2 distribution days …
Today, Citigroup reported earnings in line with analysts expectations, but warned of weakness in its fixed income business. This resonates with our own concerns for the US debt market. Both government bonds and corporate bond yields have been under pressure for months as we have seen an inversion of the yield curve in some U.S. …
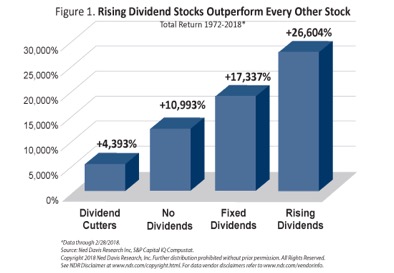
We all know that there is no such thing as the perfect investment, but I have one that comes pretty close. Working with the American Association of Individual Investors for many years, I have done research on dividend paying stocks. Investing in stocks that pay dividends offers a tantalizing triple play of 1) greater safety, …
All the major equity markets saw massive selling in the beginning of February. Correlation between all asset classes rose sharply, as usual during market corrections, making it difficult to find shelter from the retreat. Combined with the unwinding of the short volatility trade which was so popular for the last few years, interest rate fears …
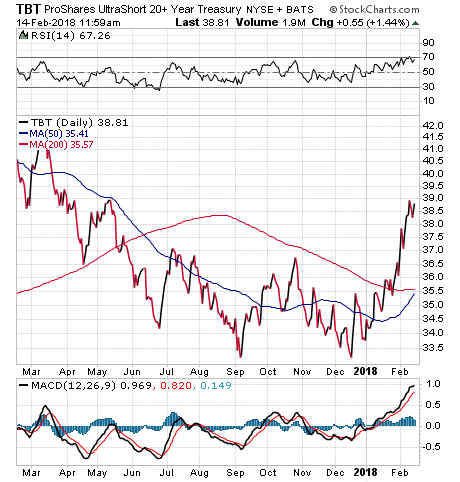
With the US Fed widely expected to raise interest rates several times in 2018, we get many questions about how to take a position that could benefit from the rate hikes using low cost ETFs. The ProShares UltraShort 20+ Year Treasury (TBT) stands out as a good idea. As bond prices and interest rates are …
All the major equity markets saw extended bullish action from December lows. This continued through most of January, with only the last few days showing some weakness. The strength of the SPY really picked up in the second half of the month. The end of the month selling was weakest in the SPY. Mid-Cap US …
We are way overbought. We are recommending our active trading clients to go to at least 50% cash or preferably higher. We are not saying this because we fear a significant downturn in the market. There is not much risk to see in strong economic data and geopolitical risks are rather muted at this point. …
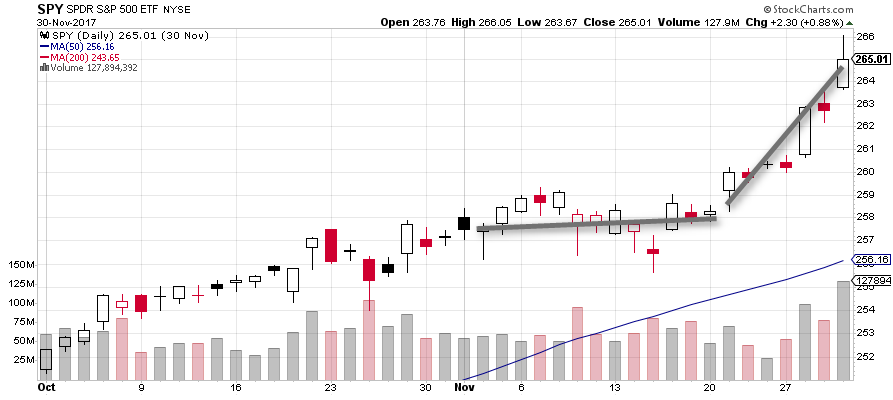
The year ended strongly for the world’s equity markets and commodities. The strength in non-US markets was exceptional. Commodities finally came back to life after months of listlessness. The S&P 500 strengthened in the first part of the month, and then traded sideways for the last two weeks. The last three months have been very …
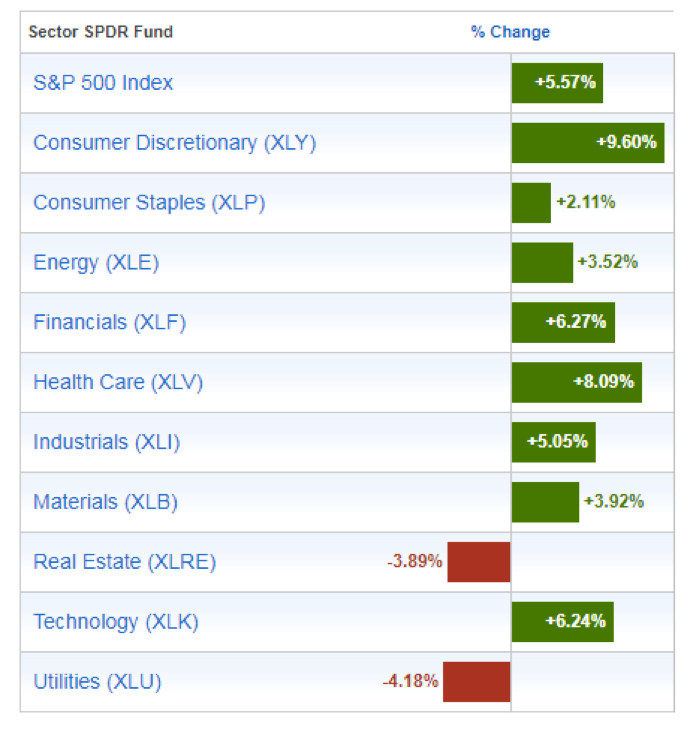
The S&P 500 closed positive for eight consecutive months in November. The index gained nearly 3% in November, and is now higher by more than 18% in price-only returns in the first 11-months of 2017. More significantly, S&P 500 has now increased 13 consecutive calendar months when including dividends. Since 1970, eight-month price-only winning streaks …