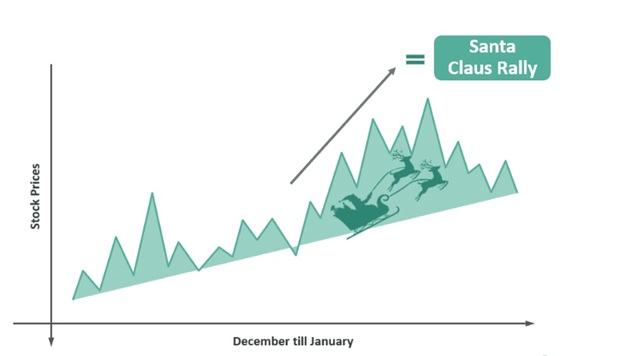
The Santa Claus Rally is a phenomenon in the stock markets that consists of a rise in stock prices from the last week of December to the first two days of January. The main goal of this rally is to raise stock prices during the Christmas season.
Retail investors are benefiting from this rally as they take the chance to make balance sheet profits in the trading sessions these days. In addition, the rally also boosts market sentiment and ensures its positive dynamics. However, no analyst or investor can predict whether a Santa Claus rally will occur in a particular year. Moreover, institutional investors, such as mutual funds and pension funds, can make adjustments to the portfolio by the end of the year.
All institutional investors tend to relax and avoid trading during this period. As a result, retail investors are taking advantage of this opportunity to create a bullish pattern. Investors are trying to buy stocks in preparation for the “January effect”. Usually, traders in this case assume that prices will rise more than in the rest of the year. As such, they tend to hoard stocks to sell them at a higher price in the new year. As traders stick to the strategy of collecting tax losses, prices fall in early December, and unprofitable investments are sold for tax gain. So, as soon as the deadline (December 31) passes, investors will start investing in stocks again.
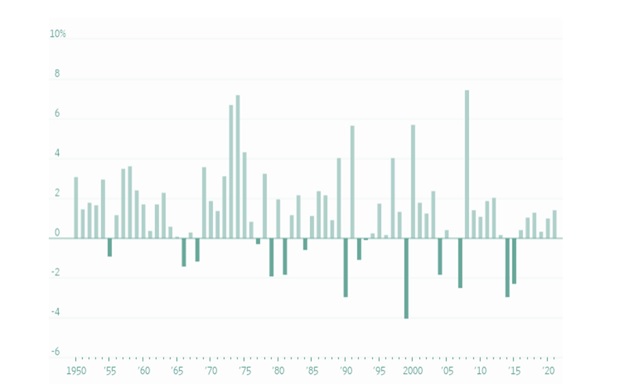
The chart below shows the history of the Santa Claus Rally by year.
The table below shows the returns of the Santa Claus Rally for the S&P 500 Index (SPX) from 1957 to 2021, from strongest to weakest. During the 2022-2023 Santa Claus Rally, the S&P 500 was up 0.8%.
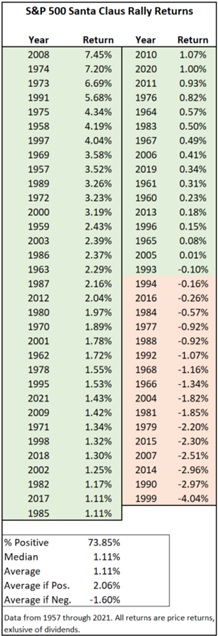
The best Santa Claus rally occurred in 2008 (last 5 trading days in December 2008 and two January trading sessions in early 2009): the SPX index rose by 7.45%.
Whatever the reason for this trend, the S&P 500 recorded an average gain of 1.10% during the rally period (from 1957 to 2021), which is quite good for weekly returns. Not only did the Santa Claus rally deliver relatively strong returns in 7 trading days, but it also posted an impressive average — since 1957, the S&P has gained nearly 74% of the time during that period. In years when the Santa Claus Rally was profitable, the average gain was 2.06%.
В то же время в те годы, когда средний убыток в период ралли составлял -1,6% (худшие показатели были зафиксированы в 1999 году), доходность SPX составила -4,04%. В прошлом году индекс S&P 500 был близок к своему историческому среднему значению, прибавив 1% во время ралли Санта-Клауса.
Другие основные индексы США показали аналогичную доходность. С 1972 года индекс Nasdaq (NASD) в среднем прибавлял в период ралли Санта-Клауса около 1,5%, принося положительную доходность в 70% случаев. Индекс Доу-Джонса (DJIA) с 1900 года также прибавлял в среднем 1,5%, причем доходность была положительной в 75% случаев.
2022 год не принес подарков: индекс S&P 500 упал более чем на 19% с начала года. С 1958 года S&P 500 заканчивал год падением на 10% или более 11 раз. Три крупнейших ралли Санта-Клауса – в 2008, 1974 и 1973 годах – происходили в те годы, когда S&P падал на 10% и более. И в конце 2022 года аналитики ожидали хорошего результата, исходя из результата ралли. Однако этого не случилось, поскольку индекс S&P 500 за новогоднее время не достиг даже своего среднего значения свыше 1%. Ниже представлена таблица по годам с результатами ралли, когда индекс S&P 500 имел итоговый годовой отрицательный результат ниже 10%.
When Santa brought the embers
At the same time, in years when the average loss during the rally period was -1.6% (the worst performance was recorded in 1999), the return of SPX was -4.04%. Last year, the S&P 500 index was close to its all-time average, gaining 1% during the Santa Claus Rally.
Other major U.S. indices have shown similar returns. Since 1972, the Nasdaq Index (NASD) has averaged about 1.5% during the Santa Claus rally, yielding positive returns 70% of the time. The Dow Jones Industrial Average (DJIA) has also gained an average of 1.5% since 1900, with returns positive 75% of the time.
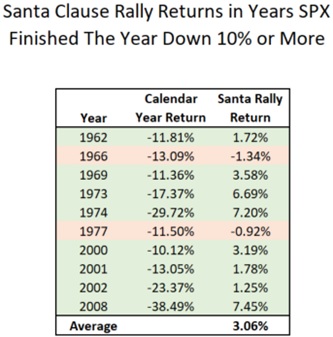
2022 was not a gifted year, with the S&P 500 down more than 19% year-to-date. Since 1958, the S&P 500 has ended the year down 10% or more 11 times. The three biggest Santa Claus rallies — in 2008, 1974 and 1973 — occurred in years when the S&P fell 10% or more. And at the end of 2022, analysts expected a good result, based on the result of the rally. However, this did not happen, as the S&P 500 index did not even reach its average value of more than 1% during the New Year. Below is a table of the years with the results of the rally, when the S&P 500 index had a final annual negative result of less than 10%.
Below is a scatterplot of the Santa Rally for the three main benchmarks.
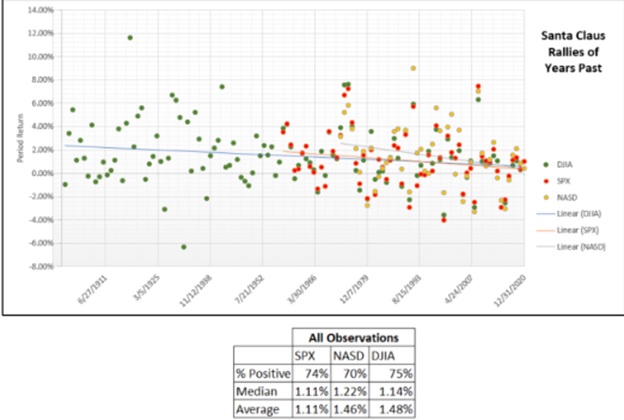
One of the things that contradicts the historical bias of the Santa Claus Rally is the negative slope of the trend line visible on the chart, which means that we are witnessing the magnitude of the Santa Claus Rally decreasing over time.
Of course, it’s impossible to know for sure what this year has in store: whether the last week of the year will be marked by another holiday for investors or whether Santa will leave behind a lump of coal. This year has certainly given enough reason for optimism, with the S&P 500 likely to end 2023 with returns above 20%. What was the average value of the S&P 500 during the rally if its annual return was over 20%? The answer is presented in the table below.
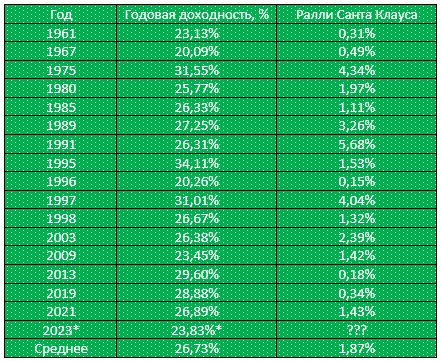
With a sample of years with a return of more than 20%, the probability of a positive outcome of the New Year’s rally is very high. The average for a period of more than 60 years is 1.87%. Only four years in our study had returns of less than 1% during the Santa Claus rally.
We hope that Santa will please investors at the end of the outgoing year. We will talk about the results of the rally at our webinar in January 2024.