Since we warned at the end of January, volatility in the US has exploded, throwing the markets into disarray. The intermediate-term trend is bearish, with extreme oversold conditions likely to produce sharp, but short-lived, rallies. We will look at some important indicators to see how oversold the markets are and what usually happens at times when markets sell off quickly.
Extremely Weak Market Breadth
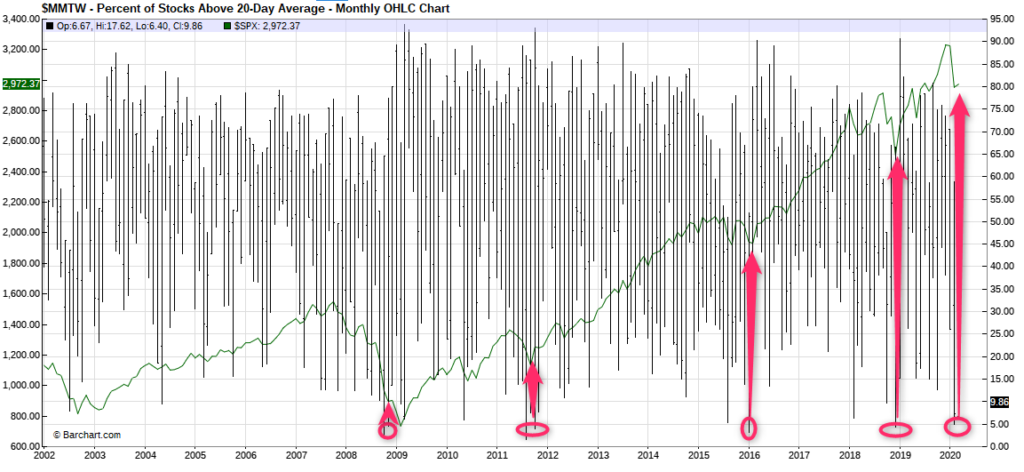
The number of stocks below their 20-day moving average is at levels from where markets general stage long-term rallies. The chart below shows that in the past 20 years the market has hit such oversold levels only 5 times.
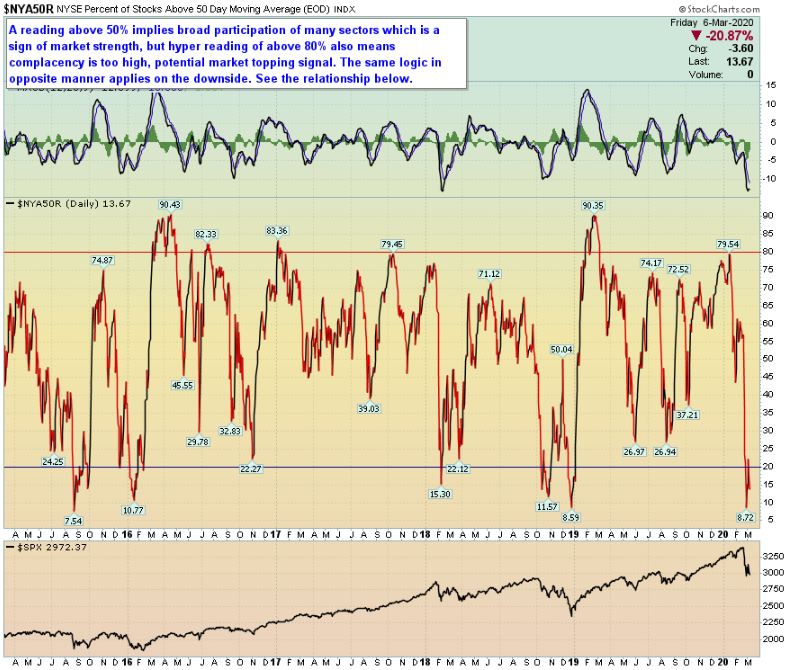
The percentage of stocks below their 50-day moving averages is also at an extremely oversold level.
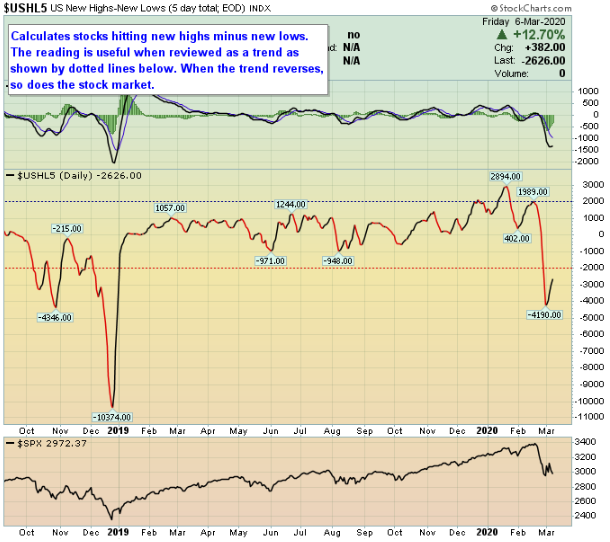
The number of stocks that hit new 52-week lows have already reversed to a positive trend. However, this trend needs to continue to the upside before a definitive trend change can be determined. Friday, March 5th was another trading day when more than 90% of stocks traded to the downside. These are usually always followed by strong up days.
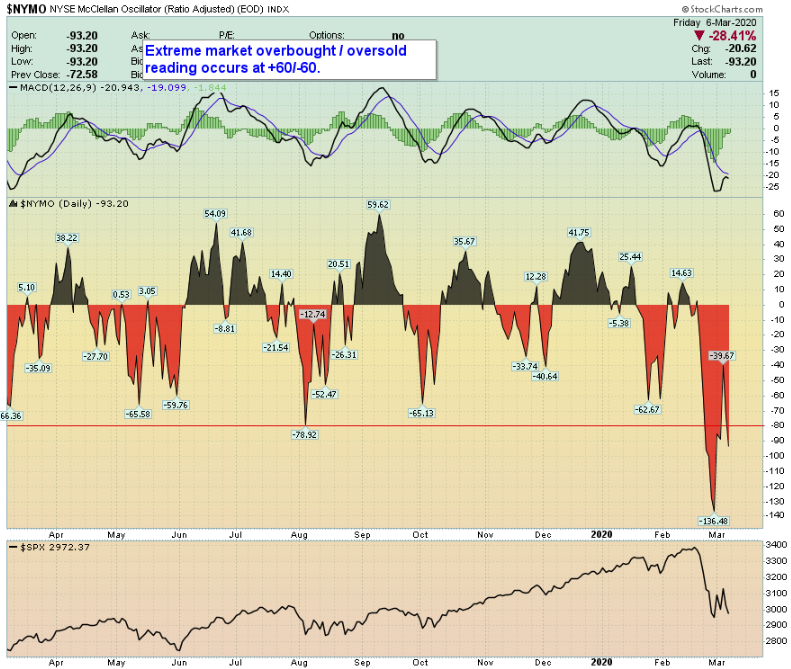
Looking at more esoteric indicators, the chart below shows the volume on declining stocks is far outweighing the volume of the rising stocks trading recently. Again, the $NYMO shows that the market breadth is extremely oversold at current levels, and some rebound can be expected in the short-term.
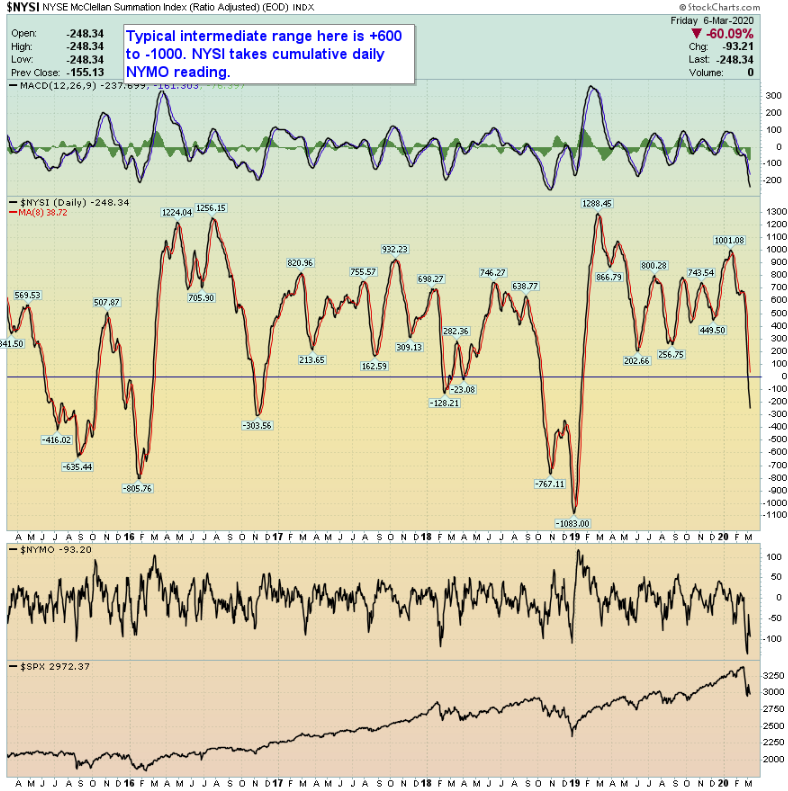
However, looking at $NYSI (a summation index of $NYMO readings) in the graph below, the market has yet to show signs of turning higher. It can continue much lower if history is any guide as $NYSI is not yet completely oversold.
High Volatility
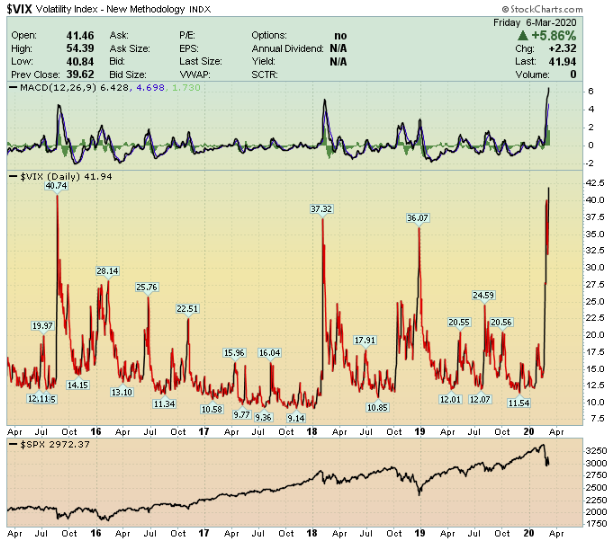
Volaitility indexes have exploded to the upside recently. These levels have not been recorded since 2015. $VIX readings above 30 are rare events. This week, the market reached levels above 40.
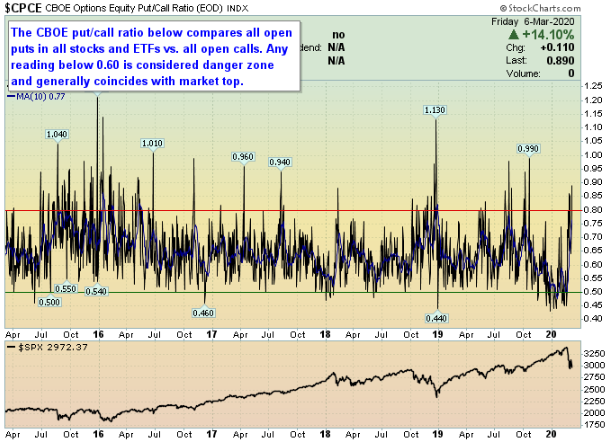
Looking longer-term Put/Call Ratio levels (a factor that are used to calculate $VIX) in the $CPCE chart below, the market is entering an extremely oversold, negative state. However, this ratio is coming from extreme overbought levels (below 0.45). Therefore, a spike higher in the $CPCE chart can be expected before total market capitulation.
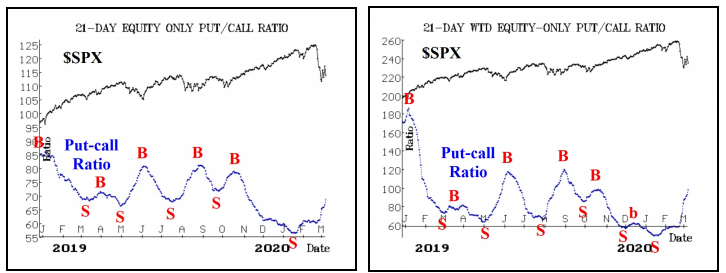
As McMillan publishes weekly, the moving average of the equity-only Put/Call ratio is trending higher from extreme overbought (low) levels on the charts below. As long as these charts move higher, the market is likely to remain under pressure. As the lines are only about half up the chart to an expected oversold level, more volatility is likely to continue.
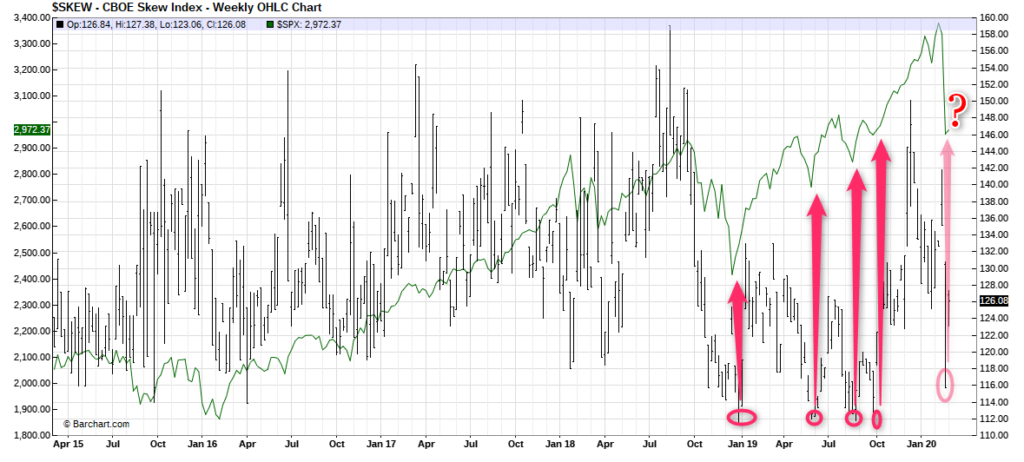
The $SKEW reading (relative price of equi-distant puts vs calls on the $SPX) can be another telling signal that markets are likely getting oversold. Recently, there was a $SKEW reading below 115. This level often poses an area where markets start to gain some stability. A few readings at this level, or lower, would create a nice cluster marking a relative bottom for the $SPX.
In summary, this is an intermediate-term bear market. The decline in points has been huge, but not in percentage terms, so there could be more to go. However, short term tradeable rallies will exist.