Recently Bloomberg commented on a newly released study by Hendrik Bessembinder regarding how many global stocks that actually perform well. Variations of this study have been done by a number of different academics and practitioners – all with fairly similar conclusions – many stocks are duds.
Two years ago, an Arizona State University professor made waves with a study showing all the wealth created by U.S. stocks is the result of gains in a weirdly small group of companies. Now he’s back with an update that shows the situation is no cheerier in the rest of the world.
Hendrik Bessembinder, a 62-year-old researcher in financial market design, and his team sifted through about 62,000 stocks traded in more than 40 countries between 1990 and 2018. Their finding: about 60% were such duds they did worse than one-month U.S. Treasury notes. The proportion was even greater than in the initial study, which focused on the U.S.
The findings have implications for everything from wealth creation to the math measuring investor skill, but got the most notice in the active-vs-passive debate. Since big gains are so rare and yet so crucial to overall returns, it helps explain why stock pickers struggle to keep up with indexes.
“It is historically the norm in the U.S. and around the world that a few top-performing companies have great influence over how the market does overall,” Bessembinder, a professor at the W.P. Carey School of Business at Arizona State, said by phone. “It’s the norm and I expect it to be the case in the future.”
It’s the observation that so few do so much for so many when it comes to the generous gains offered by share indexes. While the equity market as a whole created over $44 trillion in shareholder wealth between 1990 and 2018 and beat Treasury notes, the total is reliant on gigantic, compounding returns from a just a handful of companies, the report says.
By themselves, Apple Inc., Microsoft Corp., Alphabet Inc., Amazon.com Inc., and Exxon Mobil Corp. accounted for more than 8% of global net wealth creation during the period. Most of the rest generated negative wealth.
Investors have heard this refrain before, that just a scant few pull the pack. And it’s easy to see their outsize influence: Microsoft, Apple, Amazon.com and Facebook Inc. account for more than 20% of the S&P 500’s returns this year. That number is even starker for the tech-heavy Nasdaq 100, for instance, where those four companies account for about 50% of gains.
But Bessembinder and his team, including two co-authors from Hong Kong Polytechnic University and Goeun Choi of Arizona State, are among the first to look at the phenomenon long-term. The best-performing 306 firms accounted for about three-quarters of global net wealth creation during the 28-year period of the study, they found. Just 811 companies could be framed as accounting for all of it.
Their findings echo Bessembinder’s previous work. In looking at nearly nine decades of U.S. stock and bond performance, he found that out of 26,000 stocks, about 58% underperform Treasury bills in their lifespan.
It is because of this reality – that many stocks are duds – that we have embraced a relative strength-driven approach to investing. One of the strategies that we developed over a decade ago and which has become one of our most popular is our Systematic Relative Strength International Portfolio which uses relative strength to identify 30-40 ADRs to hold in the portfolio. We believe that relative strength not only helps us identify and stay with leadership, but also helps us weed out losers from the portfolio.
See below for the results of this strategy over time:
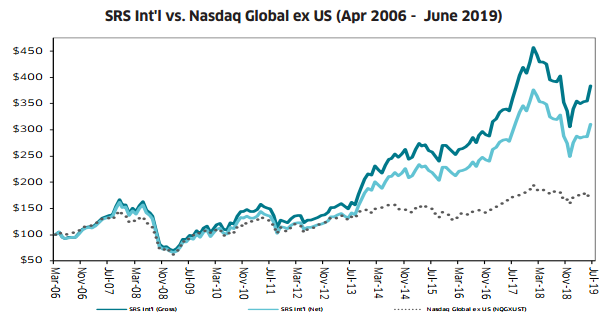
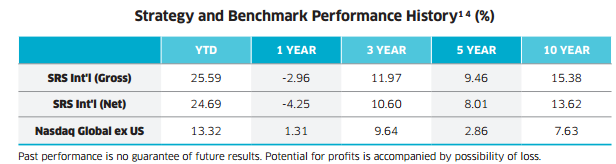
The performance represented above is based on monthly performance of AVC Advisory’s Systematic Relative Strength International strategy. Net performance shown is total return net of management fees, commissions, and expenses for managed accounts, managed for each complete month for each objective, regardless of levels of fixed income and cash in each account. The starting values on 3/31/2006 are assigned an arbitrary value of 100 and statement portfolios are revalued on a trade date basis on the last day of each quarter. All returns since inception of actual Accounts are compared against the NASDAQ Global ex US Index. The NASDAQ Global ex US Index Total Return Index is a stock market index that is designed to measure the equity market performance of global markets outside of the United States and is maintained by Nasdaq. The performance information is based on data supplied by the Manager or from statistical services, reports, or other sources which the Manager believes are reliable. Past performance does not guarantee future results. In all securities trading, there is a potential for loss as well as profit. It should not be assumed that recommendations made in the future will be profitable or will equal the performance as shown. Investors should have long-term financial objectives when working with AVC Advisory. The relative strength strategy is NOT a guarantee. There can be times where all investments and strategies are unfavorable and depreciate in value. Relative Strength is a measure of price momentum based on historical price activity. Investors in securities with values influenced by foreign currencies, effectively assume currency risk, because foreign-currency-denominated securities are subject to fluctuations in exchange rates that could have an adverse effect on the value or price of, or income derived from, such securities.