The third quarter ended with the 50th new high for the S&P 500 of the year as the bull market in US stocks continues. The S&P 500 increased by more than 4% during the quarter – its eighth straight quarter of gains. Real volatility has shrunken to record lows also, as CBOE Volatility Index (VIX) trades below 10. The Dow Industrials ($DJI) witnessed a 5.2% improvement on the quarter. The NASDAQ grew almost 6% overcoming its main component’s, Apple (AAPL), recent struggles to claim its fifth straight quarterly move.
Looking only at September, most major equity indices recorded favorable performances again: the S&P 500 index advanced by 1.7% while the Euro Stoxx 50 jumped by 4.4% (although the FTSE did not fare so well and actually declined). The performance from Asia was mixed with the Nikkei 225 rising by 3.3% – its best month this year – but the Hang-Seng Index dropped by 1.4%. Australia fell for a fifth straight month, however, with the weakness in commodities (especially iron-ore).
Gold Futures foundered for a 2.8% loss in September- its largest single month drop in nearly two years after the U.S. dollar finally appreciated on the back of the long awaited US tax reform. This pressured the interest rate on the 10 year US Treasuries back above 2.3%. Crude oil bubbled up 12% in the third quarter with the bulk of those gains coming in September as all 4 weeks of witnessed positive momentum pushing Oil Futures back up above $50 a barrel.
So, where do markets go now? October can be volatile as it marks the end of the weak 6 months period of the year, so a pullback should not be ruled out. However, with a background of globally synchronized growth, interest rate stability, holiday season and consumer enthusiasm, the outlook for the fourth quarter is favorable – but possibly not so robust as of late. Although many commentators currently view the US equity market as relatively expensive, US valuations can improve dramatically, if Trump’s proposed tax reforms are to be taken into account.
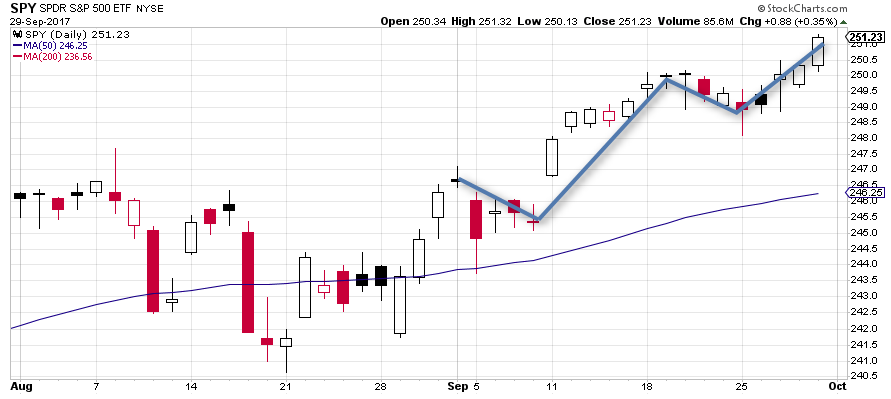
The S&P 500 was strongest in the mid and final weeks of the month. Its price is moving bullishly higher above its 50-day moving average, which is far above its 200-day moving average.
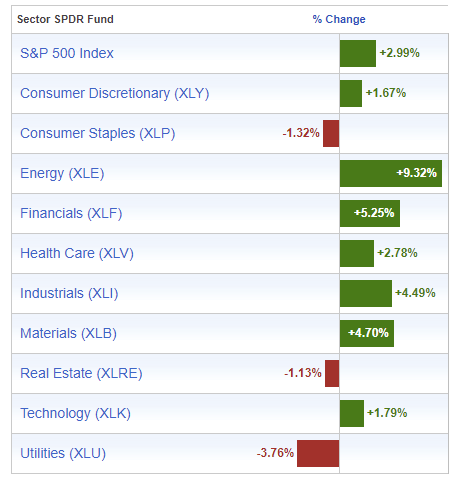
September’s largest moves came from Energy and Financial Sectors, followed closely by Materials. Utilities and Consumer Staples fell. This sector profile is bullish for the market going forward.
US small and mid-cap stocks did extremely well during the second and fourth weeks of the month, also. Lately, they have led the market higher – a bullish omen for all US equities. After recent weakness in August, the 50-day moving averages are now curling up as they maintain levels above the 200-day moving averages.


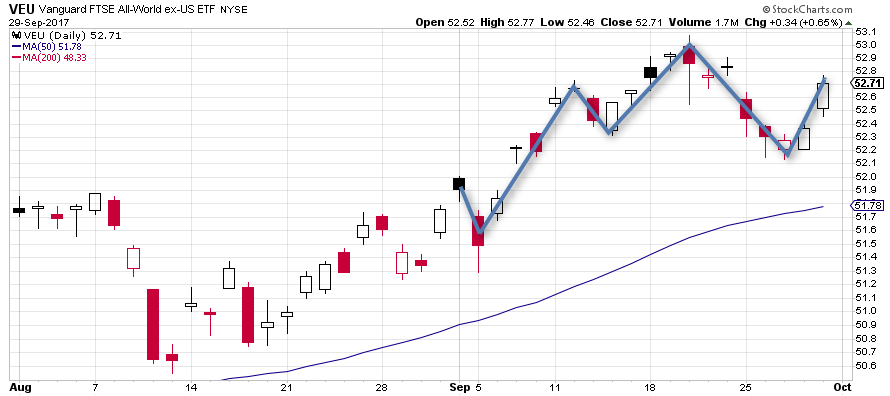
Non-US developed market traded higher in September. There was some weakness during the third week of the month.
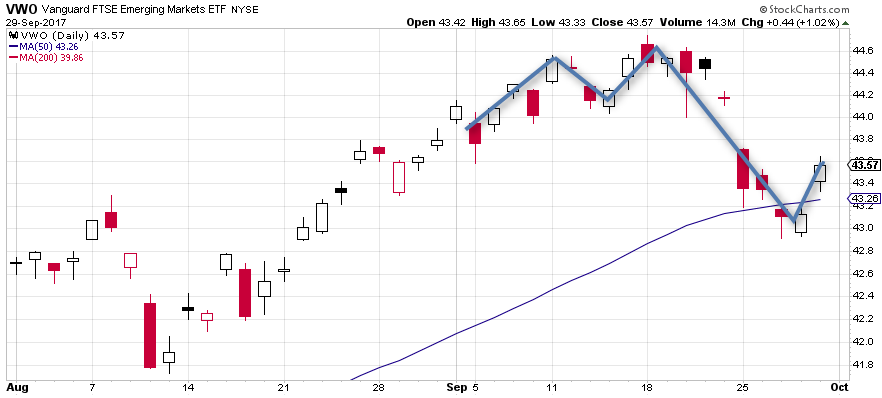
Emerging markets underperformed in September. The third and fourth weeks of September failed to hold the highs. VMO spent two days below the 50-day moving average before bouncing back on the last day of the month. This makes emerging markets only tentatively bullish for October, if they can make a bounce higher here.
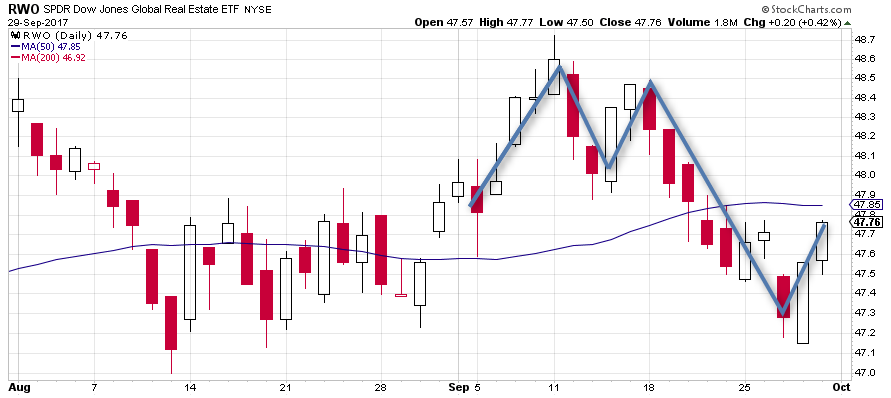
Real Estate stocks were choppy until they broke down in the third week of the month also – much like the emerging markets. RWO now trades below its 50-day moving after hovering below it in August. While this is not outright bearish, the Real Estate sector looks like it may see some sideways movement in October.
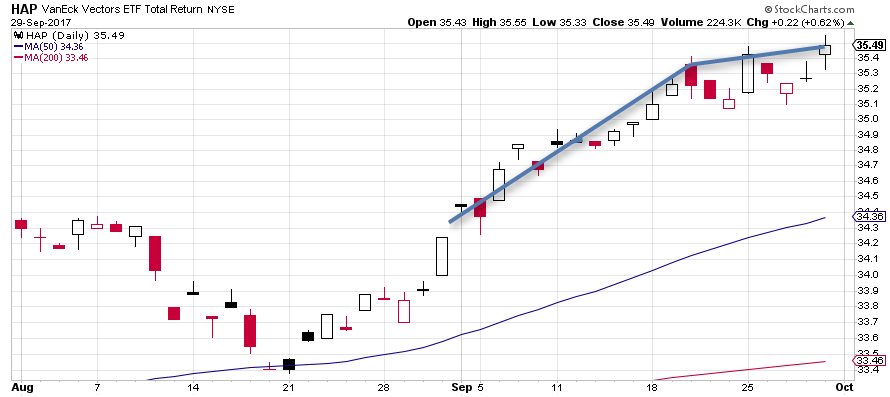
As noted in the sector breakdown of the S&P 500 dispalyed above, commodity producers (energy and building materials companies) outperformed other sectors in September. Most of the gains came from the first two weeks of the month continuing their move from the end of August.
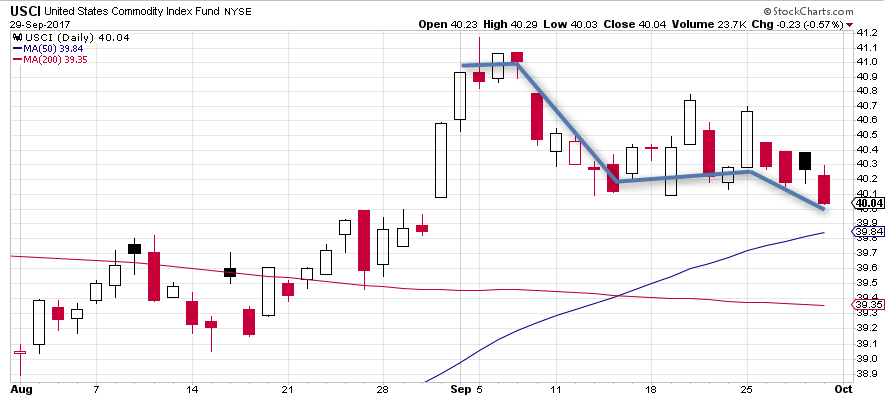
Commodity prices did not support the move seen in the graph above. USCI could test its 50-day moving average in October. Continued weakness in commodity prices could continue to be a problem for Emerging Markets.
US government bonds dropped in the last three weeks of the month. After a successful initial test of the 50-day moving average, AGG traded three days below it. This could be a setting up for a stronger, more bearish move in government bonds, which would dovetail into the story of a continuing bullish move in equities.

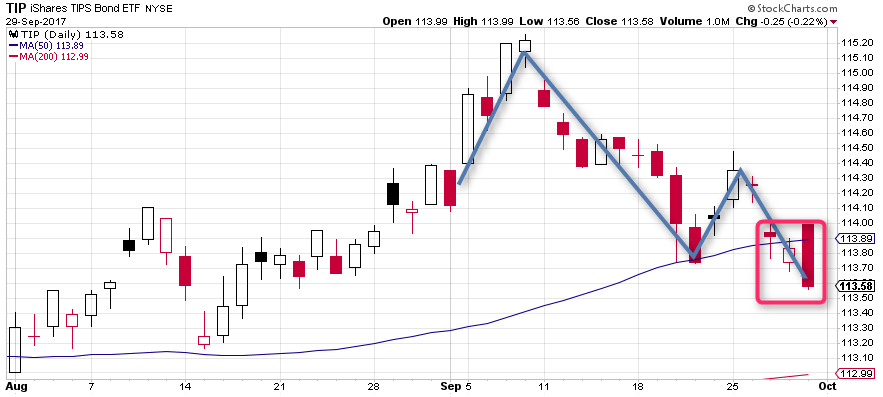
Inflation indexed bonds (TIPS) similarly suffered in the last three weeks of September and are now trading below support after a failed bounce off the 50 day moving average. The move on the last day of the month appears ominous of lower prices as inflation remains non-existent.
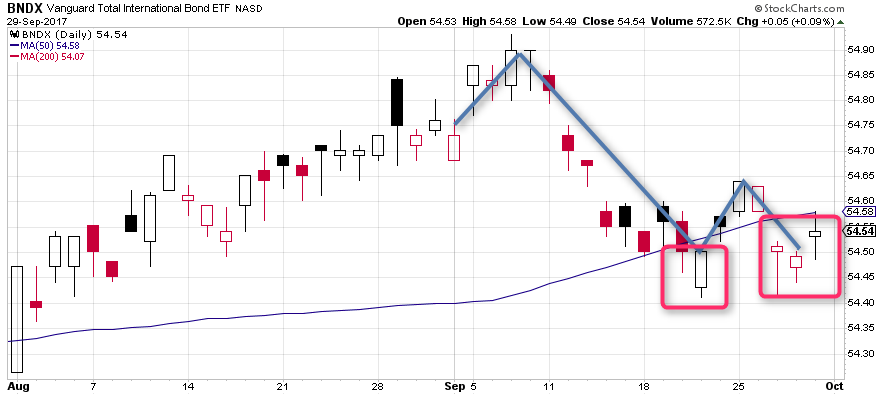
Weakness was also apparent in non-US bonds. BNDX broke down below its 50-day moving average, and (just like AGG) has traded three consecutive days there. In summary, all the bond ETFs have upward tracking 50-day moving average that are above their 200-day moving averages, so bearishness is not overwhelming at this point. This would need to change to be more bearish on bonds.
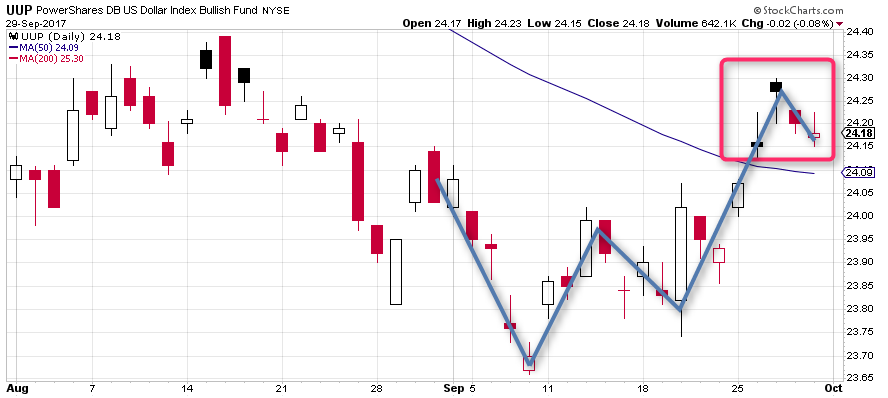
Much of the bond’s bearishness can be viewed in the context of USD bullishness, as witnessed in UUP’s action in the last two weeks of the month. At the end of September, UUP traded above its down-sloping 50-day moving average for 4 days. The strength of USD bearishness is weakening after its low made in early September.