 We are through the first month of 2015 and the market is trading very differently this year as compared to last year, ever since the Fed turned off their printing presses. Volatility has been elevated since January 1st and investors really don’t know which way to push stocks since they are fairly to fully priced at 16.3x forward earnings.
Summary of Influences & Indicators for US Equities
Technicals of the major index charts – The major indices (DOW, SPX, COMPQ, NDX and RUT) are back below their 50 day EMAs, and the small caps (RUT) are slightly outperforming. Once the indices break back over their 50 day EMAs and hold above these levels for 3 to 5 days, it will increase the probabilities that the 200 day SMAs will hold as support through February. If this does not happen, a larger down move in US equities can be expected.
Technicals and Relative Performance of Specific Industry Sectors – Key sectors that drive the economy or are viewed as “risk on” – Technology (XLK), Transports (IYT), Semiconductor (SOX) and to a certain extent Industrials (XLI) are back below the 50 day EMAs. This is bearish for the broad market.
Behavior of the Component Stocks within the Dow, SPX and NDX Indices, and Behavior of High Quality Stocks – Many stocks within the SPX and NDX are not trading well. For the highest quality stocks with the highest ratings in earnings and revenue growth, these stocks are still holding up okay, where most have pulled back to the 50 day line in orderly fashion. However, a large % of the stocks within these indices don’t look healthy.
Volatility – Implied volatility for the S&P 500 index remains elevated and points to stocks trading sideways for the near future.
Economic Fundamentals – The US economy’s GDP is growing at +2.5%; the labor market is expanding with the Dec jobs report posting +252k new jobs; Interest rates are low; inflation is low; energy costs and other input costs are low; the FED is accommodative; companies have a lot of cash on their balance sheets; and the dollar is strong. All of this data is a net positive for equities.
Credit Markets – High yield debt (HYG) is sending a “risk off” signal and we need to pay attention to this as bouts of “debt default fear” can easily spill over into equities. The 10 year T-bill is in a confirmed UP trend (i.e. cash has been moving in, which is pushing down the interest rate) and it’s been sending a “risk-off” signal for almost a year. So far, the equities market has been ignoring the risk-off signal coming from the 10 year T-bill.
European Markets – All of the charts are bearish, but the ECB announced a round of Quantitative Easing and this will most likely push up European equities.
Asian Markets – China (FXI) is near a 52 week high, Korea (EWY) has stabilized, and Taiwan (EWT) recently rebounded back above its 50 day EMA.
Corporate Earnings – Forward, fourth quarter S&P500 earnings are projected to be $124. Earnings have expanded for 8 consecutive quarters. On the negative, earnings growth is expected to fall to an anemic 1.0% or lower for Q414, and analysts project earnings growth to go negative for Q115.
Valuation – Based on forward projected S&P500 earnings of $124 and the S&P500 index (SPX) at 2018, the price/earnings ration (P/E) is 16.3, which is elevated compared to historical figures. Historical P/E averages for the S&P500 are the following: 5-year (13.6), 10-year (14.1), and 15-year (16.1). The SPX peaked in 2000 at a P/E of 21.
Seasonality – For the past 20 years, February has been a flat month.
Ongoing External or Geopolitical Events that Could Escalate Further:
- Low oil prices will continue to cause damage to certain US industries and oil producing countries that rely on $100 oil, such as Russia and Iran;
- There is fear of global deflation;
- Greece recently voted in a new left-wing, anti-austerity government that increases the probabilities that they will re-negotiate the terms of their bailout, possibly default on their debt, and/or exit the Eurozone.
The above ongoing events will most likely cause periodic shocks in Q1 and Q2 2015 that will increase the market’s volatility.
Review of World Markets
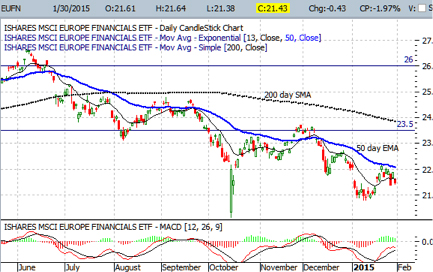
Below is the Ishares MSCI Europe Financials ETF (EUFN) – This index is below the 50 day SMA and the 50 day SMA is below the 200 day SMA. This is bearish for the European Union countries and it could cause a strong sell-off in the US markets (again) sometime in the near future.
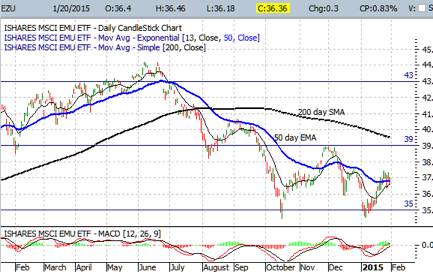
Below is the Ishares MSCI European Union ETF (EZU) that holds approx. 300 stocks in myriad industries, across 10 EU countries. This index is near the 50 day SMA, but the 50 day SMA is still below the 200 day SMA, which is bearish. The 2nd chart shows PMI data for the European Union countries as of January 2nd, telling us that a few of the smaller countries are doing okay, Germany is neutral and France and Italy are struggling.
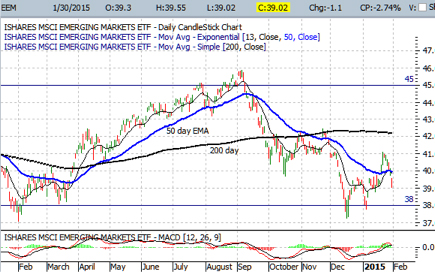
Below is the EEM, an ETF that represents large companies within emerging markets around the globe. This chart is weak, where most of the weakness has been caused by a strong US dollar and declining commodity prices.
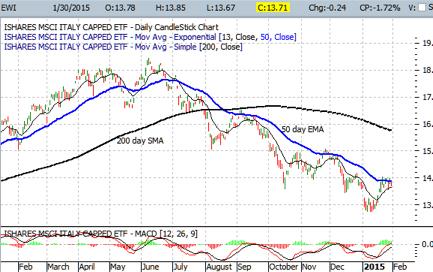
Below is EWI that represents a basket of Italian companies. This index is below the 50 day SMA and the 50 day SMA is below the 200 day SMA, which is bearish.
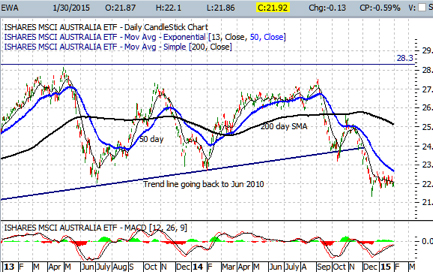
Below is EWA, an ETF that tracks a basket of Australian companies. This index broke down through its long term trend line. Australia is a large commodity exporter of iron & aluminum ores, copper and coal, so its stock market is a barometer for global growth. Because China is growing at only 7% to 8% annually and there are signs of a global slowdown and possible deflation, this is depressing commodities and pulling down Australia’s stock market.
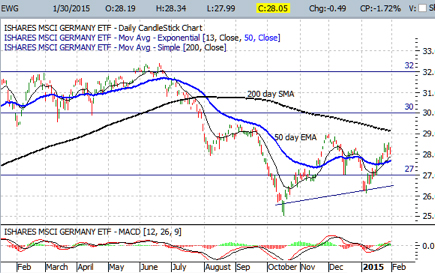
ДBelow is EWG, an ETF that tracks a basket of German stocks. This index is back over the 50 day SMA, which is positive. Manufacturing data for Germany reported early in January told us that the German economy is stabilizing.
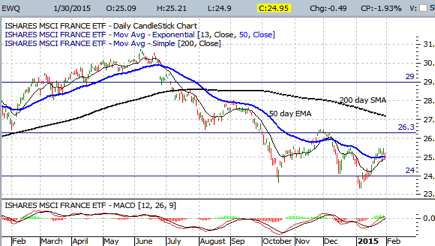
Below is EWQ, an ETF that tracks a basket of French stocks. This index is back above the 50 day EMA, which is mildly positive.
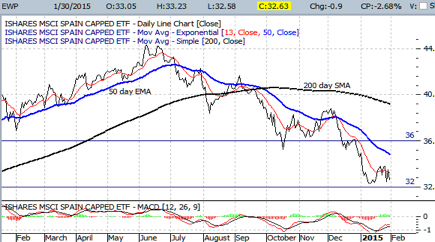
Below is EWP, an ETF that tracks a basket of Spanish stocks. This index is below its 50 day SMA and the 50 day line is below the 200 day line, which is bearish.
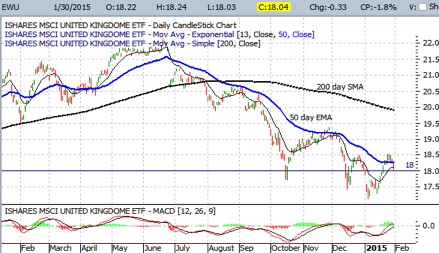
Below is EWU, an ETF that represents a basket of stocks in the United Kingdom. This index is below the 50 day SMA and the 50 day SMA is below the 200 day SMA, which is bearish.
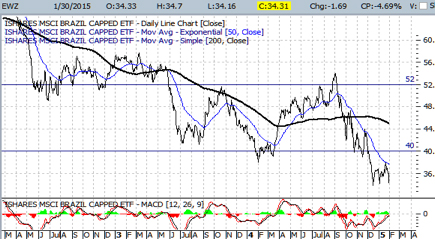
Below is EWZ, an ETF that represents a basket of Brazilian stocks. This index is below the 50 day SMA and the 50 day SMA is below the 200 day SMA, which is bearish.
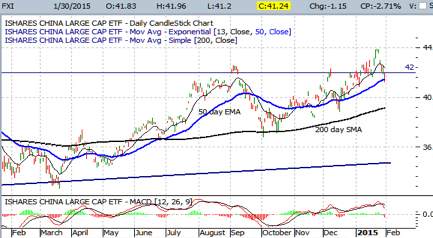
Below is the FXI that represents a basket of Chinese stocks. FXI broke up through 42 and is finding support, so far, at the 50 day EMA, which is constructive for Asia.
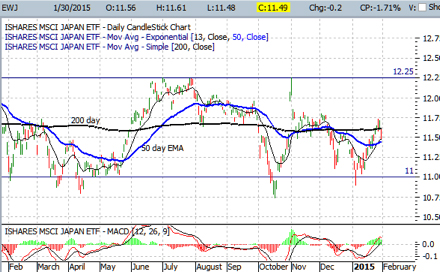
Below is the EWJ that represents a basket of Japanese stocks. This ETF has been stuck in a sideways trading range, while Japan’s economy continues to expand.
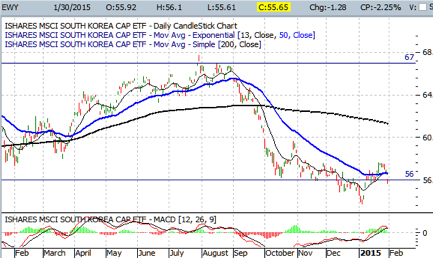
Below is the EWY that represents a basket of South Korean stocks. This ETF is back below the 50 day EMA, which is bearish.
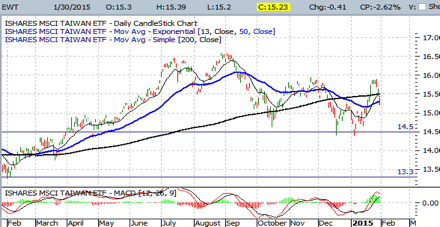
Below is the EWT that represents a basket of Taiwanese stocks. This ETF is back below the 50 day and 200 day SMAs, which is bearish.
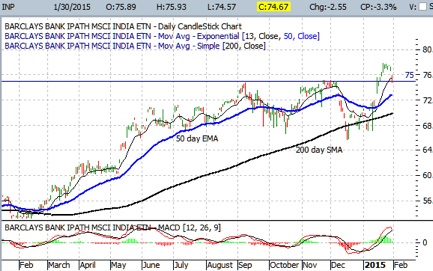
Below is the INP that represents a basket of companies in India. This ETF found support at the 200 day SMA and bounced, and it recently broke out to a new high.