Category: Analytics
- 17.03.2020
- Categories: Analytics, AVC Pro Subscription, Investment ideas, Personal finance
- Tags: IWM, Russell 2000, SPX, SPY
After stocks suffer large declines, certain companies perform better during a rebound. Besides focusing on timing the bottom, investors need to know what is likely to perform best. We show some historical statistics to get investors ready.
- 17.03.2020
- Categories: Analytics, Investment ideas, News, Personal finance
- Tags: SPX, Stocks
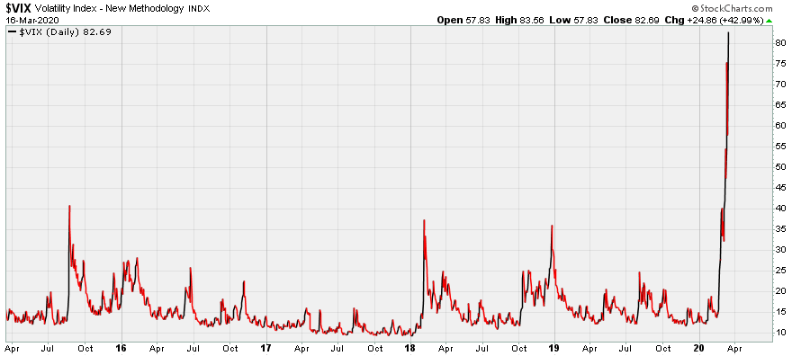
Volaitlity is spiking to levels not seen since 2008. Should long-term minded investors run for shelter?
With no light at the end of the tunnel these bleak times seem desperate. But what happens usually after VIX spikes like the one we are currently experiencing? We look at the months and years after intense volaitility to find solace in the future of the economy.
- 16.03.2020
- Categories: Analytics, AVC Pro Subscription, Personal finance
- Tags: NASDAQ, Russell 2000, s&p500, SPX

After the close on Thursday, the main US markets entered a bear market for the first time in 11 years. A simple virus killed the bull.
How long do bear markets last, and are they always accompanied by a recession? We take a look at history to find answers.
To access this post, you must purchase Subscription Plan – AVC Pro.
- 8.03.2020
- Categories: Analytics, Investing basics, Personal finance
- Tags: CPCE, NYMO, NYSI, P/C Ratio, SKEW, SPX, vix, volatility
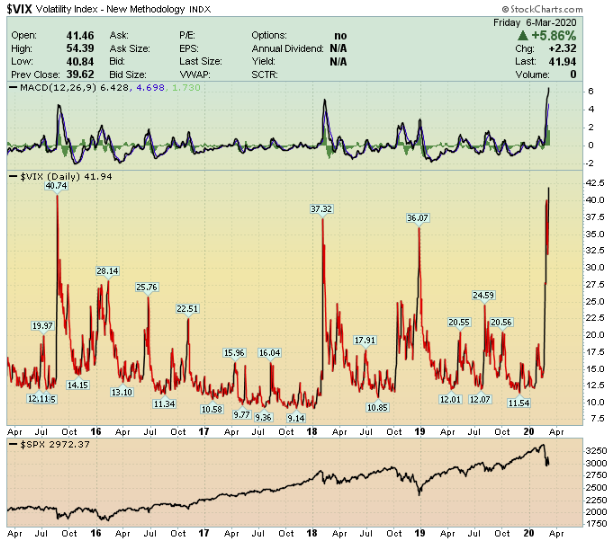
Volatility in the US has exploded, throwing the markets into disarray. The intermediate-term trend is bearish, with extreme oversold conditions likely to produce sharp, but short-lived, rallies. We will look at some important indicators to see how oversold the markets are and what usually happens at times when markets sell off quickly.
- 7.03.2020

Large daily moves in both directions of 2-5% and huge intraday swings have taken a toll on markets and psyches. But the February 28 low has held through this week’s wild swings.
According to sector seasonality, there are two sectors that begin their seasonally favorable periods in March: High-Tech and Utilities.
To access this post, you must purchase Subscription Plan – AVC Pro.
- 23.02.2020
- Categories: Analytics, AVC Pro Subscription, Investing basics, Personal finance
- Tags: DJIA, NASDAQ, Russell 2000, Seasonal Strategy, SPX

Unlike weather and the biblical tales, stock markets in March usually start with stability and turn wild with volatility towards the end.
To access this post, you must purchase Subscription Plan – AVC Pro.
- 6.02.2020
- Categories: Analytics, Investing basics, Personal finance
- Tags: Momentum, Relative Strength, Sectors, SPX
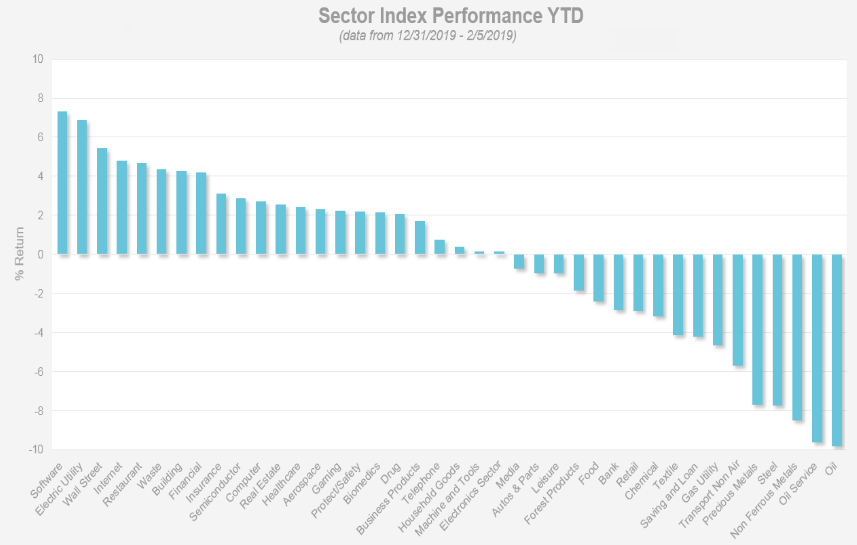
Relative strength-based investing performs best when there is a high level of dispersion between market leaders and laggards. Since the beginning of this year, this has been the case. Semicondutors, software, waste management and computer technology sectors are leading, while oil related stocks are lagging.
Using relative strength-based investing strategies can lead to significant long term market outperfomance compared to 'buy and hold' strategies.
- 5.02.2020
- Categories: Analytics, AVC Pro Subscription, Personal finance
- Tags: DJIA, January, S&P 500

January finished January down 0.2%. But the does not necessarily meaan the rest of the year will be. We look at the historical record to see how other years performed when January did not do well. It turns out 2 of 3 indicators often are enough to propel the markets higher.
To access this post, you must purchase Subscription Plan – AVC Pro.
Fundamentally speaking, US growth is slowing. Technically the markets are consolidating. After a steady rise from early-October through mid-January, DJIA, S&P 500 and NASDAQ appear to be taking a breather. Monetary policy remains loose, interest rates are low and are likely to remain low. QE4 or repo market support is now expected to continue through at least April 2020. February is seasonally neutral for markets, and investor sentiment is fading. Any pause in market trends is likely short-lived.
To access this post, you must purchase Subscription Plan – AVC Pro.
- 10.01.2020
- Categories: Analytics, AVC Pro Subscription, Investment ideas, Personal finance
- Tags: SPX, XLC, XLE, XLF, XLk
With the new year and new decade already here, the markets closed on one of the strongest years for the US equity market in the past decade. The S&P 500 (SPX) was up nearly 29% in 2019 - the second best year in the 2010s, only 2013’s return of just over 29% beat it. All broad sectors produce gains last year, with nine out of the 11 broad sector SPDR ETFs posting gains greater than 20%. The top three sectors, using SPDR ETFs as proxies, were technology (XLK), communication services (XLC, basically a technology ETF), and financials (XLF), returning 47.90%, 29.92%, and 29.22%, respectively. Energy (XLE), on the other hand, was