We generally do not analyse individual stock for clients or agents. However, we were posed with an interesting idea from one of our agents regarding Ford (F). The stock currently trades with a P/E ratio of less than 10. The agent was wondering if this looked like a entry level for a buy on Ford. Below is our analysis on what might make Ford an interesting buy from a charting perspective.
Ford Stock Price Mark Up
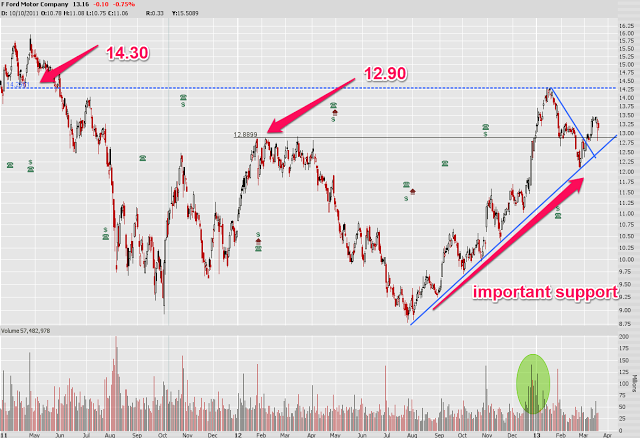
Ford is consolidating now after a very strong run up to a previous resistance level around 14.30 on heavy volume. It’s holding support at what has become an important diagonal trend line. A buying point would be around $12.66 (up to $12.88) with a stop around 12.30. If Ford broke its diagonal support trend line, this would be very bearish. An initial target price for exit would be around the $14.30 area. However, Ford is currently trading right below its 50 day Moving Average (not shown on graph). It must break above for a continued run to 14.30. This makes Ford a hard stock to read as it is not a clear bullish trending stock.
Investing is a very visual endeavour. Investors’ actions are more important than their words and thoughts. Visual representations of their actions can be seen in the price and volume action on the charts. We are very accustomed to using charting tools to identify proper entries and exists for ETF trades — many of which we have discussed on this blog or on our facebook page. These same tools can be used on individual stocks.